Graph Templates
Explore 154 examples of pre-made templates.
Select a template to customize completely free.


How To Customize a Template Into Content
4 steps to publish your chart in less than 3 minutes


Step 1
Add your data
Upload, paste, or generate the data you need with AI.

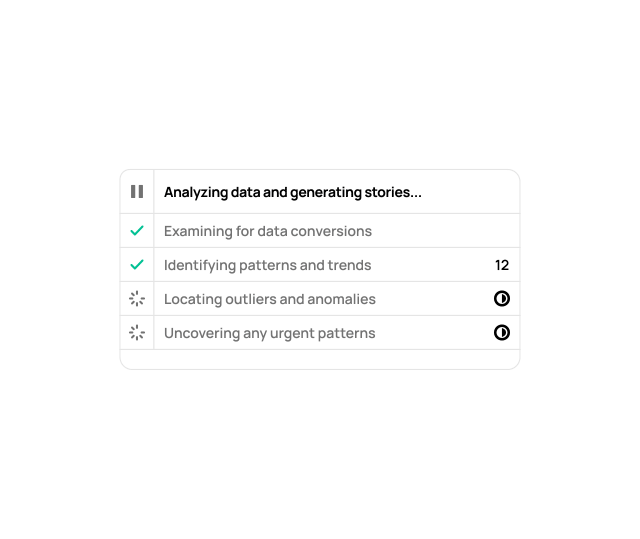
Step 2
Use AI data analysis to find a story
Automatically generate compelling stories using AI.

Step 3
Add final touches using the robust data editor
Automatically generate compelling stories using AI.

Step 4
Publish your chart anywhere
Get started completely free, publishing on any major web platform.
Join Our Community of Ambitious Story Tellers
Many disciplines, one goal: share better data-driven stories
"I'm constantly using their charts to visualize my project's progress. It's a quick, easy, and visually appealing way to communicate information!"

Yuriy Lazebnyi
Chief Business Development Officer
"Seamlessly takes all our data and delivers polished graphs and dashboards everywhere. Especially love their WordPress plugin, saves so much time."

Rayane De Sousa Mesquita
Content Marketer/ SEO Content Writer
"Chart Maker is easy to use and creates professional charts effortlessly. With smooth Google Drive integration, saving and sharing is seamless. A great choice for quick, high quality charts!"

Vladislav Godunov
Senior Frontend Developer
"I'm blown away at how easy it is to convert my Excel data into interactive charts. The process is smooth, and the results look great on my website. Highly recommend!"

Michael Franco
People Operations & HR Business Partner
"When it comes to communicating data efficiently and effectively, stop and look no further. Whether we're assessing sprint velocity or project financials it's just so easy to make it look so good."

Alexander Belkin
Project Manager
"These chart builders are super easy to use! I love how fast I can create interactive charts. It saves me a ton of time and makes my data look great!"

Daniela Parra
Business Office Manager
"Their graphing tools are a solid choice for anyone looking for a functional and data-driven visualization tool. It makes it so easy to add pro-level design to all your data."

Dmitry Oborsky
Software Engineer
"I use it almost daily for internal reports and performance analysis. It makes it so fast and easy to publish meaningful charts that perfectly match my client's brand, every time."

Fernanda Bravo
Fractional COO | Project Manager
"As a designer I've played with tons of data visualization tools and the experience is always clunky and the results feel underwhelming. Couldn't be further from the truth here, I'm constantly surprised by how accessible good design is."

Dariia Katolik
UI/UX Designer
"My go-to tool for turning static data into presentation-ready data visualizations. You can let the tool do the heavy lifting to deliver a highly impactful experience."

Olha Kutyshenko
Product Designer
"The ability to create professional-looking charts directly from my Google Sheets has been a game changer. The intuitive workflow makes it so easy to reveal the insights I'm trying to share with my team."

Liliana Martínez
Backend Developer
"As a business owner, I appreciate the easy-to-use templates and the ability to embed charts without needing technical skills. Fast, beautiful, and low-effort. A must-have tool."

Cory Blumenfeld
4x Startup Founder
"Their graphs and my workflow have become 100% inseparable. Both for my deliverables and client communication, they’ve added dramatically more professional data design to everything."

Berenice Laciar
Video Editor - Post Production Coordinator
"Started using their graphing tools to present my client's quarterly performance metrics and haven't stopped. It feels like magic presenting such professional visualizations, feels like I've hired a designer."

Mauricio Castro
NSCA Certified Personal Trainer
"I use it almost daily for marketing reports and ad performance dashboards. The export options are amazing, and the visuals are always on-brand."

Melissa Rodríguez García
Digital Transformation Consultant
Join our newsletter for data design tips, trends, inspirational charts and get +100k Free AI credits☺️ when you signup.
☺️