


Scatter Plot Maker
Design beautiful scatter plots quickly and easily with this free, zero-sign-up tool.
A scatter plot is a simple visual that uses dots to show relationships between two variables.
Each point represents a pair of values, and the patterns they form reveal correlations that are positive, negative, or nonexistent.
It's one of the clearest ways to spot connections, outliers, or clusters across data.
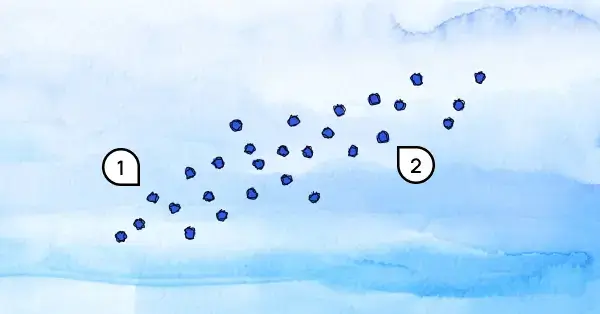 What is a Scatter Plot?
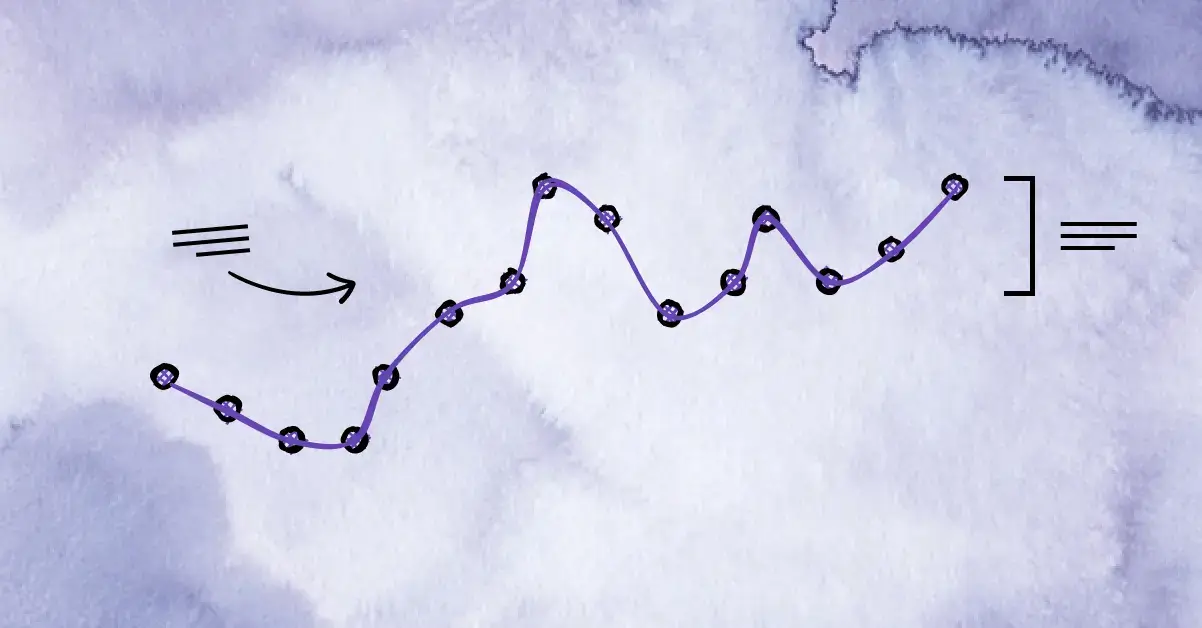 What is a Line Chart?
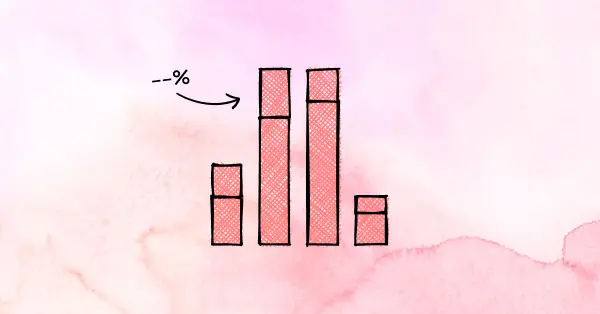 What is a Bar Chart?