


Stacked Bar Graph Maker
Design beautiful segmented bar charts quickly and easily with this free, absolutely no sign-up required, tool.
When you need to display multiple variables within one category, a stacked bar graph (or segmented bar graph), is one of the most effective options.
It allows you to stack data series in a single bar, making it easy to see both the totals for each category and the breakdown of each component.
Whether you're comparing sales across regions or monitoring progress in project tasks, a stacked bar graph offers a clear, consolidated view that highlights key insights.
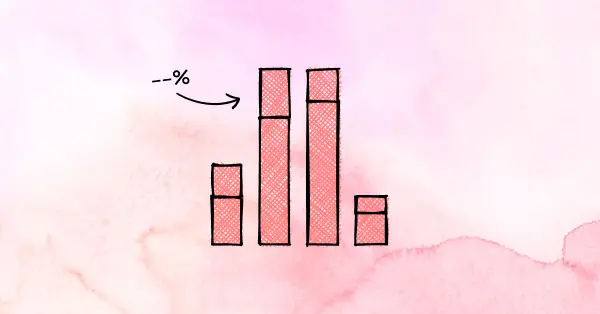 What is a Bar Chart?
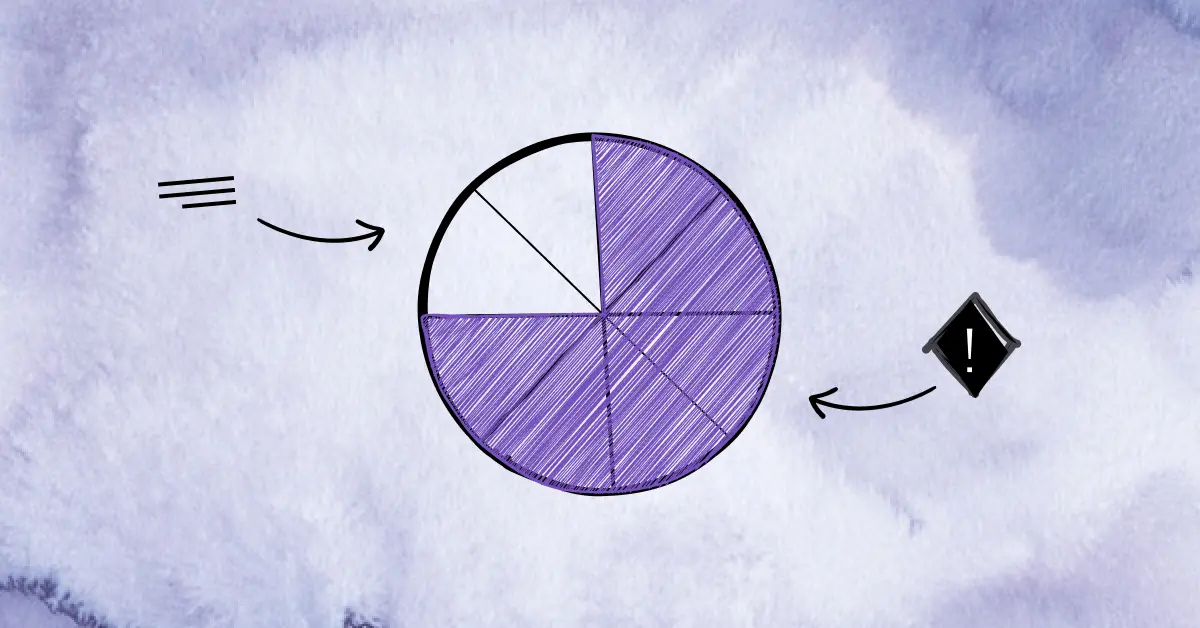 What is a Pie Chart?
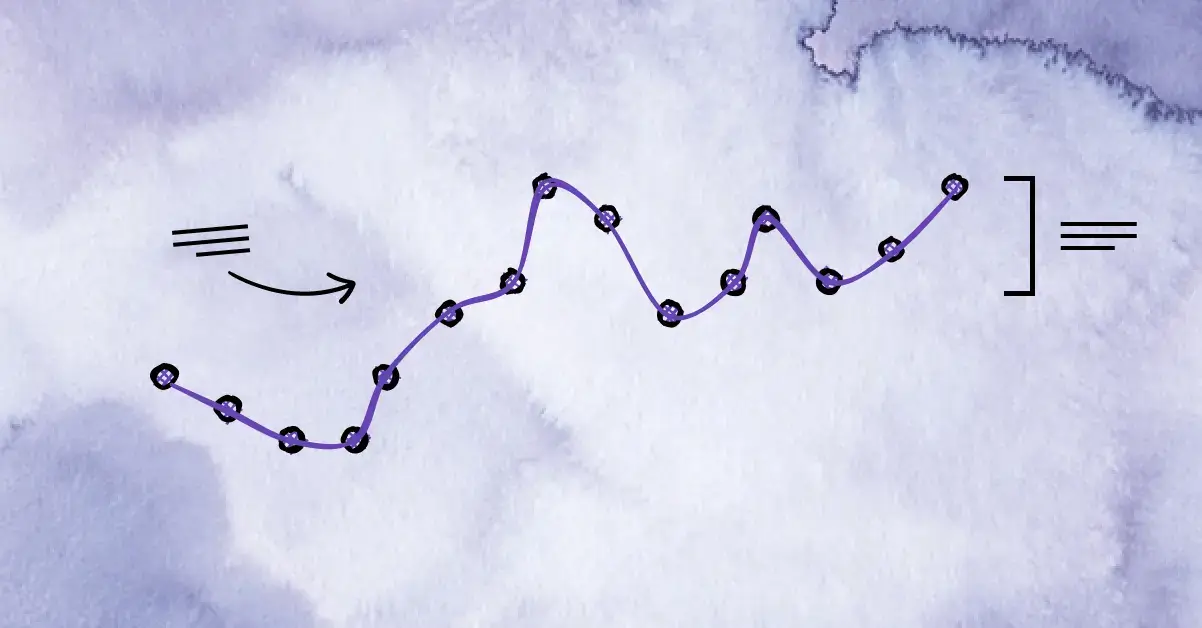 What is a Line Chart?