


Radar Chart Maker
Design beautiful radar charts quickly and easily with this free, zero-sign-up tool.
Radar charts, also known as spider charts, are one of the most versatile tools for visualizing multivariate data.
They enable you to quickly compare several metrics and discover patterns, gaps, or strengths in datasets.
If you're looking to identify any outliers and trends, compare multiple datasets, or highlight strong and weak areas, radar charts are especially effective.
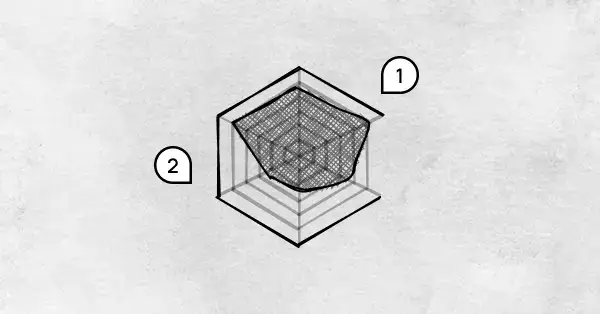 What is a Radar Chart?
 What is a Line Chart?
 What is a Pie Chart?