


Gauge Chart Maker
Design beautiful gauge charts quickly and easily with this free, zero-sign-up tool.
A gauge chart is a simple visual that uses a needle or arc to show a single value's position within a defined range.
The needle points to the current value, while color bands often indicate zones like low, normal, or high performance.
It's one of the clearest ways to display real-time status, performance levels, or progress toward a specific target.
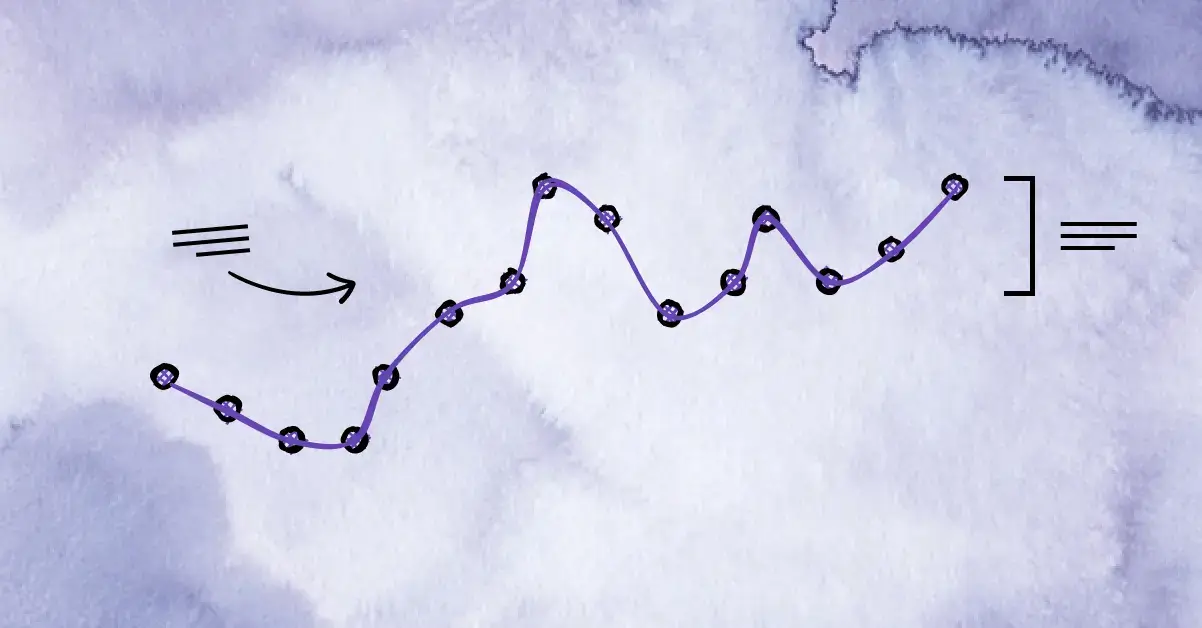 What is a Line Chart?
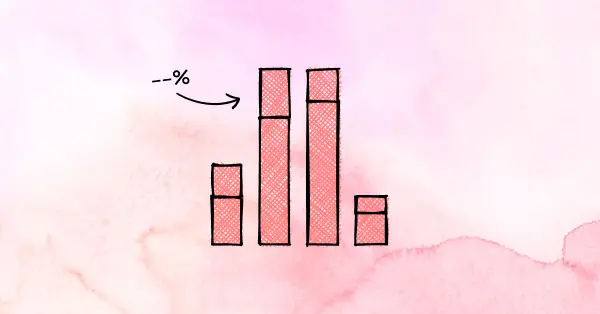 What is a Bar Chart?
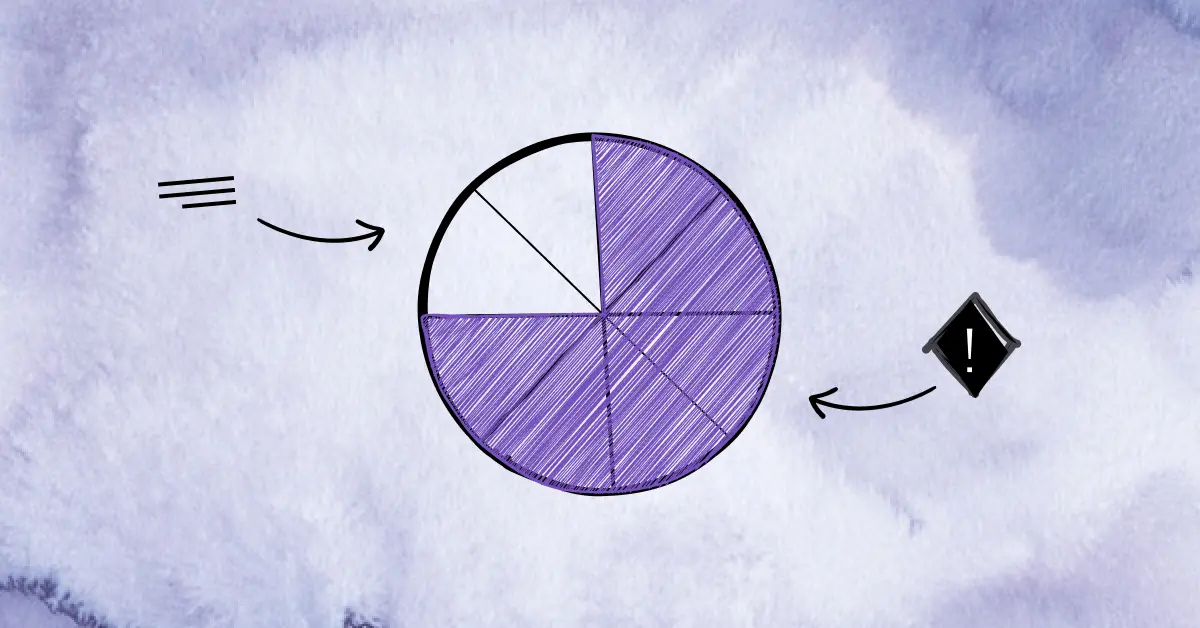 What is a Pie Chart?