Learn about our editorial policies and terms & conditions
Creating pie charts in Excel is straightforward. Whether you're performing a market share analysis, tracking sales by channel, or analyzing workforce distribution, Excel has the tools to make it possible to turn raw numbers into basic pie charts.
Here's how to make a pie chart in Excel:
- Organize your categories in one column and their values in the next.
- Select the data, open the Insert tab, and choose Pie Chart.
- Customize the chart by updating labels, adjusting colors, and choosing a cleaner layout.
- Save the file or export the chart as an image for reports, presentations, or documents.
Excel provides a quick way to build basic pie charts alongside your spreadsheets, but if you want a more streamlined experience with beautiful design options, Graphitup offers a free pie chart maker with intuitive design tools and easy customization options—perfect for creating polished visuals without a spreadsheet.
 Pie Chart Guide
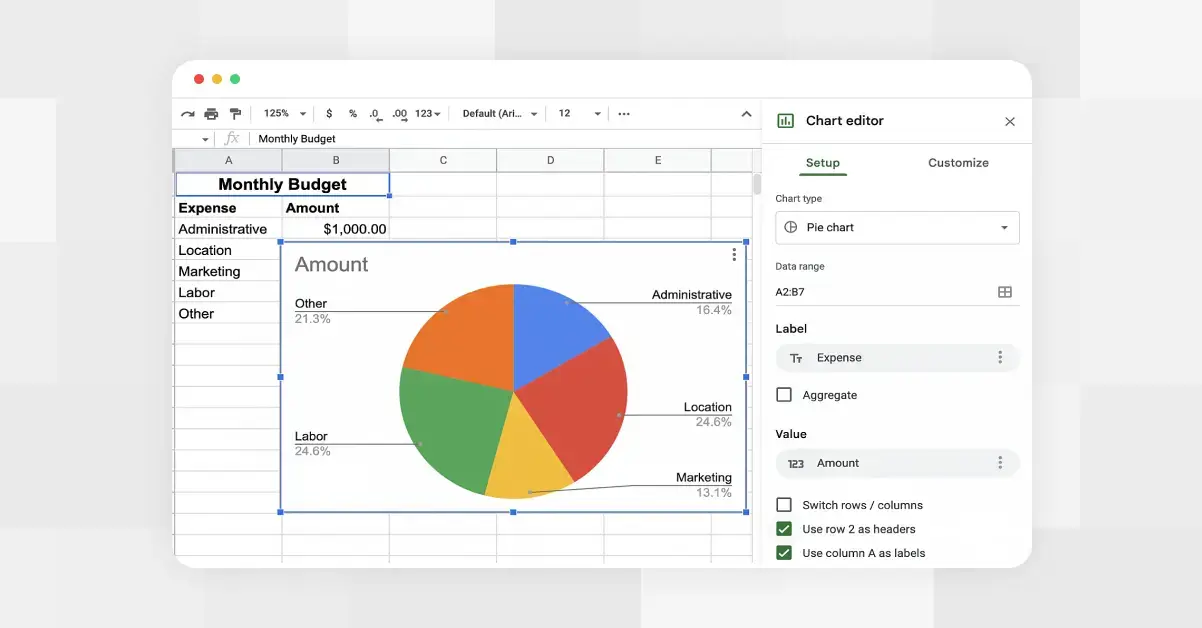 How to Make a Pie Chart in Google Sheets
 Online Pie Chart Maker - Free, No Signup