Line Graph Maker with Multiple Lines
Design beautiful multi-line graphs quickly and easily with this free, zero-sign-up tool.
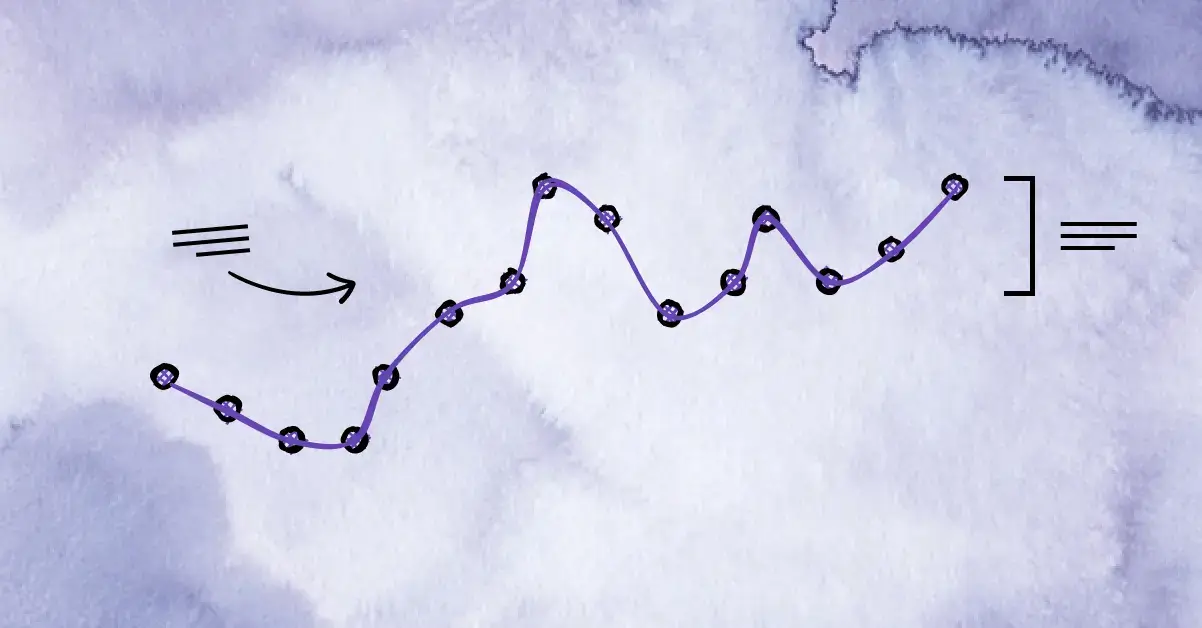
A multi-line (or multi-series) line graph, displays multiple lines on the same chart. Each line generally depicts an independent series of data or category.
Most common multi-line chart is the double line graph, which is ideal for comparing two related variables like revenue and expenses over time.








 What is a Line Chart?
 What is a Bar Chart?
 What is a Pie Chart?


